It is quite simple…
Monitor response time delivered to the end users from all your systems
Your OneView dashboard will help everybody deliver better service to the end users
How OneView will Help You
End Users
- All IT systems that you depend on are monitored in real time
- Any problem that affects the end users are highlighted
- Check the OneView dashboard before reporting a problem to the help desk
Management
- You know when any of your systems are having issues affecting productivity and revenue
- You will know how often your systems are affected by problems
- You will know the duration of your problems
- You will know the business impact of your problems
- You will know where to focus your system attention onwards
IT Operations
- Any change may or may not affect the users - identify unforeseen side effects right away
- Alarms go off immediately - know if an issue affects the end users and resolve these issues first
- You will know when the problem started - helping you to zero in on the root cause
- Communicate with all stakeholders through the OneView dashboard
- Everybody knows when there is an issue - your helpdesk is not flooded with duplicated requests
- The upgrade is not finished before all boxes are green - help your outsourcing partner deliver good service
- Distribute the OneView dashboard on info screens, on your desktop and on your mobile devices
System and Platform Owners
- Installation of OneView requires no agents and no changes in your existing system
- OneView reads the log files with zero impact on your system
- You will know if a problem affects the users on your system as soon as the issue begins
- All systems across all platforms are monitored all the time
- You will know when more than one system is hit by an issue even when they have “nothing” in common
Outsourcing Partner
- You will know about any issue that affects the end users
- Fact based dialogue with your customer based on what is delivered to the end user
- Add value to your hosting services and help your customer get better services
Baselines
OneView show you baselines of response time and availability over time. In this way you can see when current problems started, what the response time was before the last infrastructure upgrade and so on. Knowing exactly when a problem started is often a valuable help in finding the root cause and resolving the problem.
Data in OneView can also be used for creating reports for management. IT Development, IT Operations and Management all have the same live view of the same data and the same possibility to drill down and have a look at live status as well as historic status. Transparency is first step towards building stable IT systems.
Collect
OneView monitors response time and availability delivered to your end users from your IT systems. OneView monitors all your IT systems that the end users access. OneView collects all the data related to response time and availability from all sources.
OneView monitors Outlook, Portals, Internet, Intranet, Document handling systems, Workflow, Insurance systems, Finance systems and all other IT systems that your external and internal end users access.
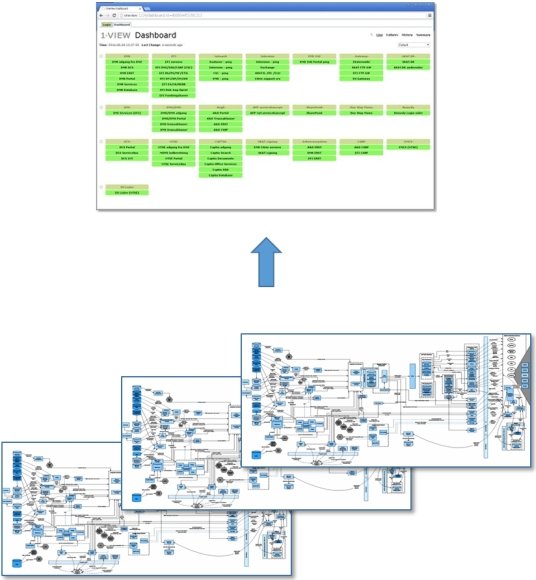
Live View
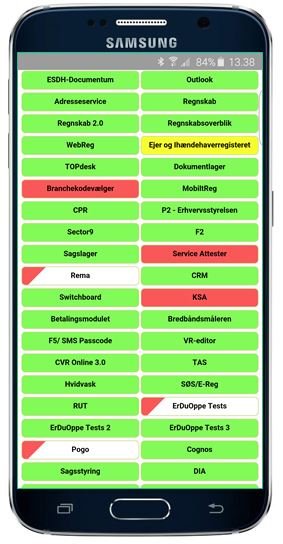
OneView delivers 100% overview. OneView is an easy-to-understand live dashboard with green boxes verifying if all your IT systems delivers a good service to your and your end-users - right now.
Green boxes on your live OneView dashboard means good service delivered to your end users. Yellow and red means that this IT system have some problems delivering good service to the end users. OneView will help you make all your IT systems more effective for internal and external users.
Data sources
OneView monitors response time and availability of all your IT systems. OneView collects data from all sources like webserver log files and databases - in short all data regarding response time and availability delivered to the end users.
If no such data is available then OneView can make simple test requests like WEB, SOAP and SQL requests. In addition, OneView can execute scripted workflows thus emulating real end user workflows on a Windows PC/server accessing any IT system.
On browser based systems OneView monitors the response of all the requests that are directed to all the web servers. On GUI based (thick client) systems OneView can monitor when the response is ready on the screen of a test PC/server using image recognition techniques
OneView server
OneView runs on a Windows server and consists of a number of components that may be installed and run separately. The central OneView component has an embedded database. This database holds both live performance data and historic data.
The data lays the foundation for your baselining, your reports and forms the basis for the root cause analysis of any problems seen in your IT systems or in your infrastructure. Response time and availability is a "catch all" metric for any problem that could potentially lead to service degradation for your end users.
OneView runs on a standard Windows server with 4 CPU cores, 8 GB RAM, C-drive for the OS and a 100 GB Data disc for OneView. The OneView data collection components can be installed on the same server or they can be placed on one or more distributed servers.
An example: Install the OneView data collection components on a few PCs that you place on selected remote offices. These PCs can monitor remotely, and send data back to the central OneView server.
OneView Cloud dashboard
Your central OneView server calculates and expose your live dashboard. In this way you know if all your IT systems delivers good service to your end users. It is possible to send status color (for security reasons only color) from your dashboard via Monsalta Cloud and thus cloud enable the status colors from your live dashboard.
The Monsalta Cloud will then deliver live status colors in a dashboard optimized for your mobile device directly in your browser anywhere in the world. This solution makes it possible for you to access the live dashboard anywhere without logging on to your internal network.
Each individual mobile OneView dashboard has a unique URL for this specific dashboard. For security reasons there is no access route from the mobile dashboard to your central OneView server via Monsalta Cloud.


